Control plane
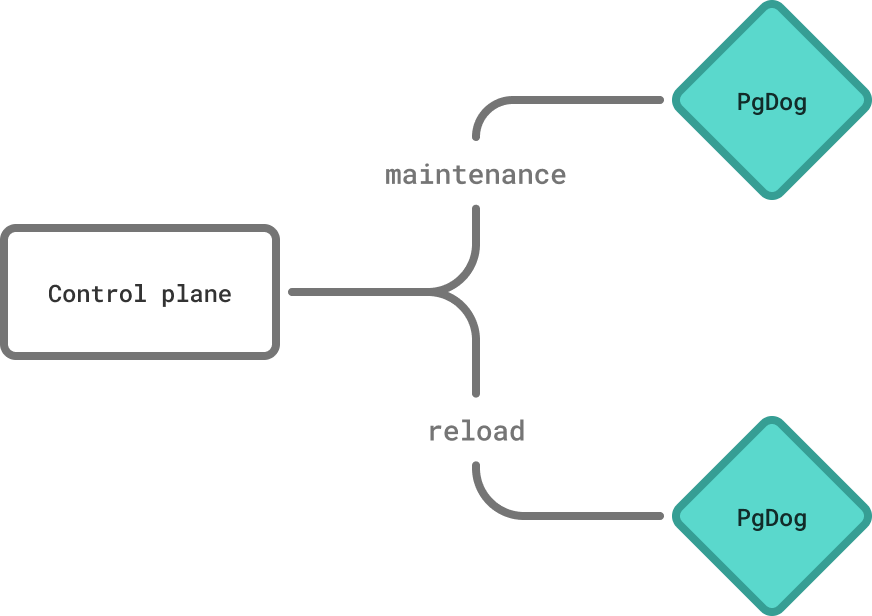
Multi-node PgDog deployments require synchronization to perform certain tasks, like atomic configuration changes, toggling maintenance mode and resharding.
To make this work, PgDog Enterprise ships with a control plane: an application deployed alongside PgDog, which provides synchronization of administative commands.
Installation
Ready to deploy? See the installation guide.
How it works
The control plane and PgDog processes communicate via the network using their own protocol, using HTTP(S) as the transport.
They exchange messages to send metrics, commands, and other metadata that allows PgDog to transmit real-time information to the control plane, and for the control plane to control the behavior of each PgDog process.
Configuration
In order for PgDog to connect to the control plane, it needs to be configured with its endpoint address and an authentication token, both of which are set in pgdog.toml:
PgDog nodes that are part of the same deployment should use the same token. It can be any string value and serves to differentiate one PgDog deployment from another.
Multiple PgDog deployments
A control plane deployment is capable of managing several PgDog deployments. It's not necessary (although possible) to have one control plane per PgDog deployment.
Connection flow
PgDog initiates a connection to the control plane on startup. This happens in the background and doesn't block queries.
Upon connecting, PgDog will send its node identifier (set in the NODE_ID environment variable, or randomly generated) to register with the control plane, and will start uploading telemetry and poll for commands.
Error handling
Since most PgDog functions (including sharding) are configuration-driven, the control plane connection is not required for PgDog to start or serve queries.
If any error is encountered while communicating with the control plane, PgDog will continue operating normally, while attempting to reconnect periodically.
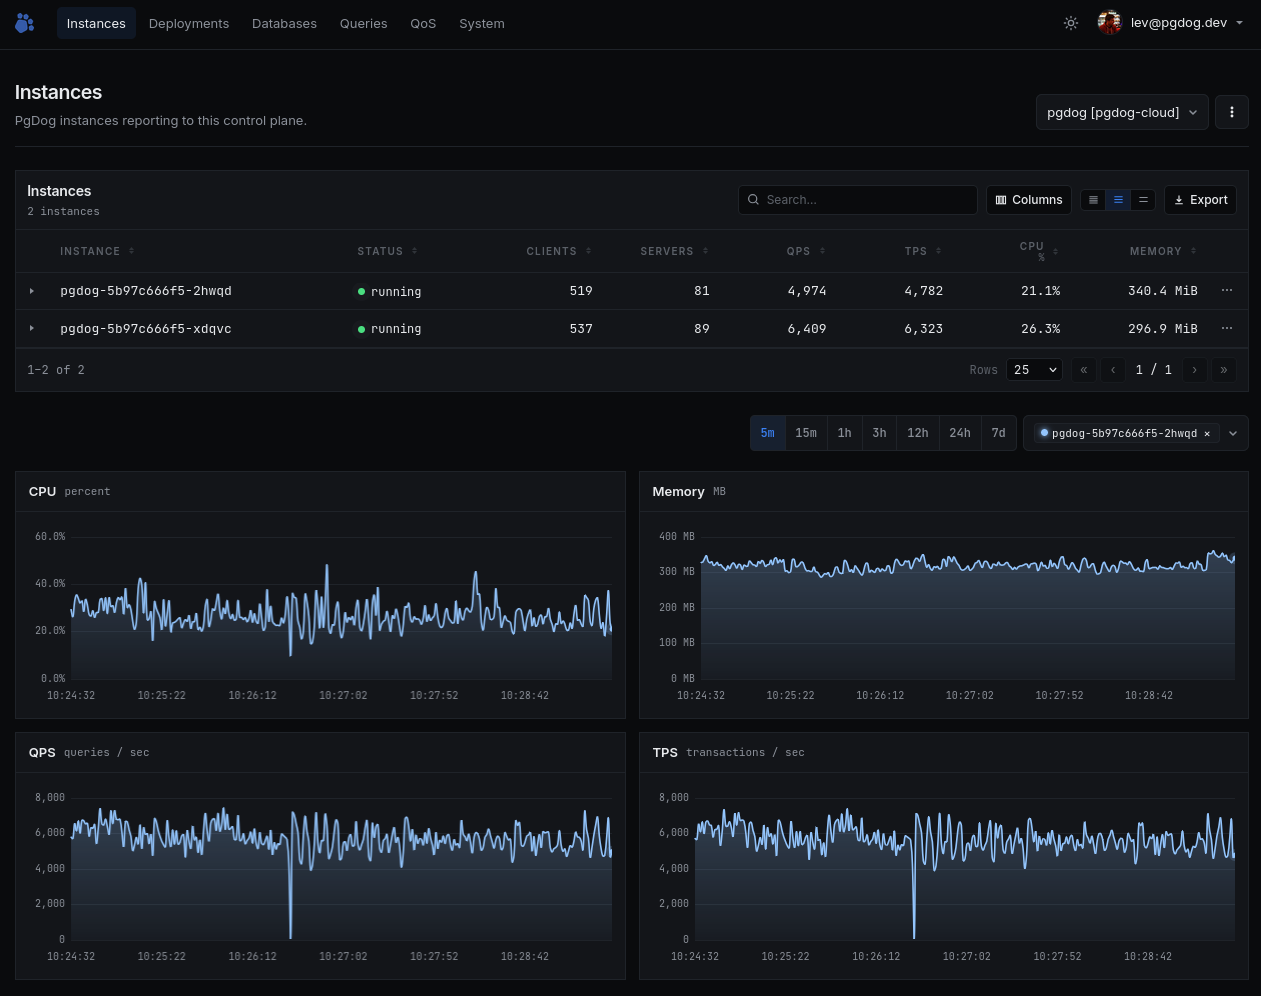
Telemetry
PgDog transmits the following information to the control plane:
| Telemetry | Description |
|---|---|
| Metrics | System and utilization metrics, transmitted on a per-second frequency. |
| Queries | Queries that are currently executing through each PgDog node. |
| Query plans | Output of EXPLAIN for slow and sampled queries, collected in the background. |
| Configuration | Current PgDog settings and database schema. |